
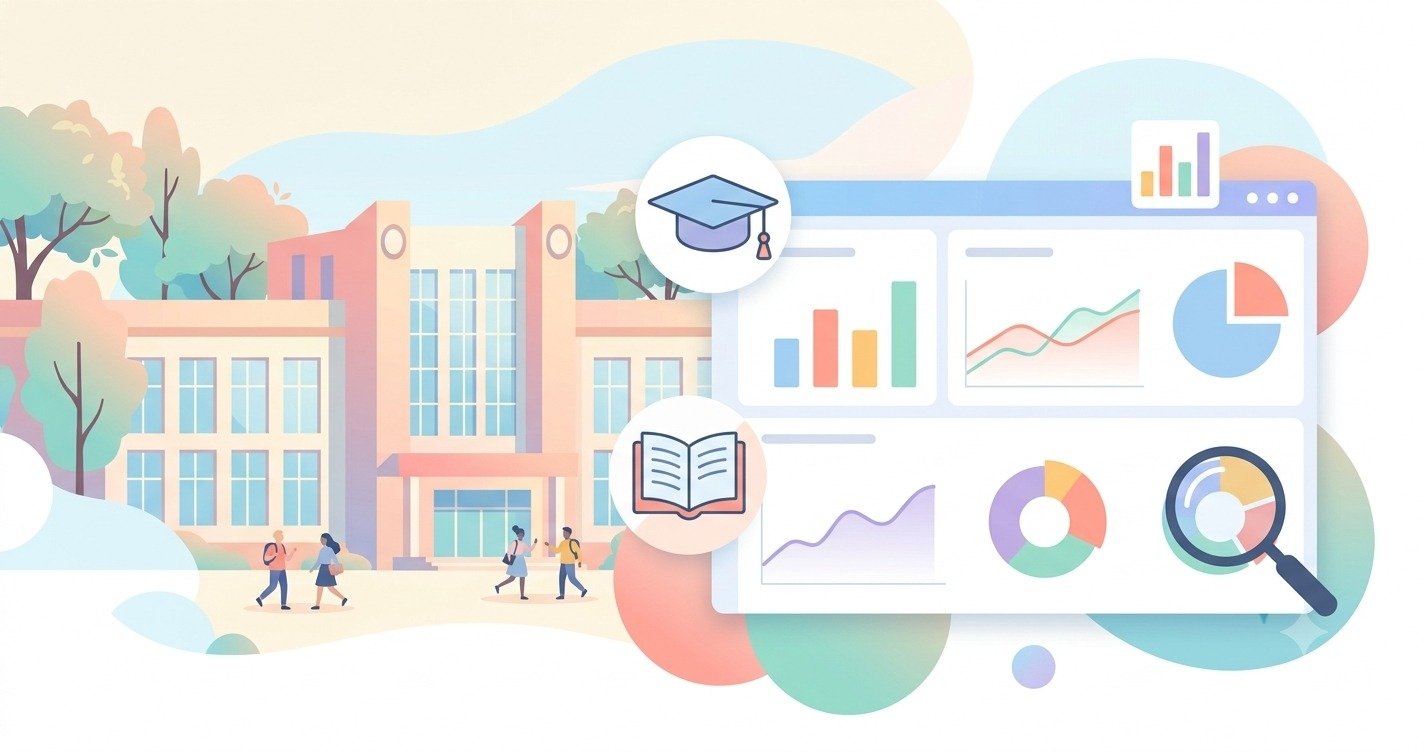
Walk into any university leadership meeting today, and you’ll hear the same question repeated in different words: “What does the data actually tell us?” Enrollment numbers, retention rates, budget forecasts, faculty workloads — the information exists somewhere in the system, but turning it into a clear answer often takes days instead of minutes. This is exactly the gap that business intelligence in higher education is designed to close.
Unlike corporate BI, which mostly tracks sales and revenue, business intelligence in higher education deals with a much messier mix of academic, financial, and human data. Students aren’t customers in a simple sense — they’re people whose success depends on dozens of overlapping factors: attendance, financial aid status, course difficulty, mental health support, even how far they live from campus. That complexity is precisely why so many institutions are now investing seriously in BI infrastructure, and why understanding it properly — beyond the marketing buzzwords — matters for anyone working in or studying higher ed administration.
This guide breaks the topic down the way institutions actually experience it: what it is, why it’s needed, what it delivers, where it gets used, what goes wrong, which tools dominate the market, how to roll it out without wasting money, and where the field is heading next. Along the way, we’ll also cover a few things most articles skip entirely — like what BI actually costs to run, how it collides with student data privacy laws, and why faculty buy-in (not technology) is usually the real bottleneck.
What Is Business Intelligence in Higher Education?
At its core, business intelligence in higher education is the practice of collecting data from across a university’s systems — student information systems, learning management platforms, finance software, admissions CRMs, HR records — and turning it into dashboards, reports, and predictive models that help leaders make decisions with evidence instead of guesswork.
It’s easy to confuse this with “data analytics” or “institutional research,” and honestly, the lines blur in practice. But there’s a useful distinction: institutional research traditionally answers backward-looking questions for accreditation and compliance (“How many students graduated last year?”), while business intelligence in higher education is built for forward-looking, operational decisions made continuously — often in near real time. A provost checking a live retention dashboard before a Monday morning meeting is using BI. A committee compiling a five-year accreditation report is doing institutional research. Increasingly, the two functions are merging under one data office.
Technically, a BI system in a university setting has four layers: data sources (SIS, LMS, ERP, CRM), a data warehouse or lake where information from these systems is cleaned and combined, a BI engine that models and queries the data, and a presentation layer — dashboards, scorecards, and automated reports — that stakeholders actually look at. Popular platforms doing the heavy lifting here include Power BI, Tableau, and legacy systems like SPSS or IBM Cognos, which many public universities still run because of long-standing licensing agreements.
What makes this discipline distinct from generic corporate BI is the subject matter it’s built around: academic analytics (course-level and program-level performance), learning analytics (individual student engagement and behavior), and administrative analytics (finance, HR, facilities). A useful BI system for a university has to speak all three languages, which is harder than it sounds — and is a big reason implementations take longer than vendors promise.
Why Universities Need Business Intelligence Today
Ask any dean or registrar why they eventually adopted BI, and the answer rarely starts with “we wanted better technology.” It starts with a specific, painful moment — a board asking why enrollment dropped and nobody having a clean answer within the meeting.
Higher education has quietly become one of the most data-heavy industries on the planet. A mid-sized university generates data on admissions applications, course registrations, grades, financial aid disbursements, library usage, dorm occupancy, career outcomes, alumni giving, and dozens of other streams — often stored in systems that were never designed to talk to each other. Without business intelligence in higher education tying these threads together, leaders are stuck making six-figure decisions based on outdated spreadsheets or a staff member’s gut feeling.
There’s also external pressure driving adoption. Enrollment has become genuinely competitive as the pool of traditional college-age students shrinks in many countries, forcing institutions to market and recruit with precision instead of blanket outreach. Accreditation bodies now expect data-backed evidence of student outcomes, not narrative assurances. And funding bodies — especially state legislatures tying appropriations to performance metrics — want proof that money produces results.
Then there’s the retention crisis that almost every institution quietly struggles with. Losing a student mid-program isn’t just an emotional loss; it’s a direct financial hit, and replacing that lost tuition through new recruitment costs far more than retaining an existing student would have. Business intelligence in higher education gives early-warning systems a fighting chance — flagging a student whose attendance is slipping or whose LMS logins have gone quiet, weeks before a human advisor might otherwise notice.
Finally, there’s a workforce argument that gets less airtime: staff are drowning in report requests. Without a centralized BI function, an institutional research office might spend half its week manually pulling numbers for department heads. A working BI system doesn’t just inform decisions — it frees up real human hours.
Key Benefits of BI for Colleges and Universities
The benefits of business intelligence in higher education tend to show up in three overlapping areas: academic outcomes, financial health, and operational efficiency — though in practice they reinforce each other.
Better student outcomes. Predictive dashboards can flag at-risk students based on a combination of signals — missed assignments, declining grades, reduced LMS activity, or financial aid gaps — long before a manual review would catch them. Advisors then reach out with targeted support rather than reactive damage control after a student has already withdrawn.
Smarter resource allocation. Universities routinely over-staff some departments and under-resource others simply because nobody had visibility into actual demand patterns. BI dashboards showing course fill rates, faculty workload, and space utilization let administrators shift resources to where students actually need them, rather than where historical inertia placed them.
Stronger financial planning. Tuition dependency, grant cycles, and unpredictable enrollment make higher ed budgeting genuinely difficult. Business intelligence in higher education lets finance offices model multiple enrollment scenarios and their budget impact instead of relying on a single static forecast that’s often wrong by the time it’s approved.
Improved recruitment and marketing ROI. Instead of spending equally across all channels, admissions teams can see exactly which recruitment sources — a specific fair, a digital campaign, a referral program — actually convert into enrolled, retained students, and reallocate budget accordingly.
Faster, less political reporting. When data lives in one governed system instead of scattered spreadsheets maintained by different departments, arguments over “whose numbers are right” mostly disappear. This alone is often cited by staff as the most immediately felt benefit of rolling out BI — not the fancy predictive models, but simply ending the reporting turf wars.
Accreditation and compliance readiness. Because BI systems continuously track outcome metrics, institutions spend far less time scrambling to assemble evidence when accreditation reviews come around — the data trail already exists.
One underappreciated benefit worth naming directly: BI tends to improve institutional trust. When decisions are visibly backed by shared dashboards rather than closed-door assumptions, faculty and staff are more likely to accept unpopular decisions, because the reasoning is transparent rather than political.
Top Business Intelligence Use Cases in Academia
Theory aside, here’s where business intelligence in higher education actually shows up on a day-to-day basis across real institutions.
Enrollment and admissions funnels. Dashboards track applicants from inquiry through enrollment, showing exactly where prospective students drop off — after applying, after being accepted, or after depositing — so recruitment teams can intervene at the precise leak point instead of guessing.
Retention and early-alert systems. This is arguably the single most cited use case. Systems combine attendance, grades, LMS engagement, and even financial-aid status into a single risk score, triggering automatic alerts to advisors when a student crosses a risk threshold.
Academic program performance. Department chairs use BI to see which courses consistently have low pass rates, which programs are growing or shrinking in demand, and where curriculum bottlenecks are quietly hurting graduation timelines.
Financial and budget dashboards. CFOs track tuition revenue against projections in near real time, model the financial effect of enrollment shifts, and monitor grant spending against deadlines.
Faculty workload and staffing analytics. HR and provost offices use BI to balance teaching loads fairly across departments and to plan hiring based on actual, not assumed, demand.
Facilities and space utilization. Universities routinely discover — often for the first time via a dashboard — that certain buildings sit half-empty most of the week while others are overbooked, informing renovation and new-construction decisions.
Alumni engagement and fundraising analytics. Advancement offices segment donor data to identify likely major-gift prospects and track which outreach campaigns actually convert into donations.
Library and resource usage tracking. Some institutions correlate library visit frequency and resource checkouts with grade outcomes, using the data to justify continued investment in academic support services — a use case Evisions’ own research on higher ed BI specifically highlights as an underused opportunity.
Quality assurance and accreditation reporting. IEEE-published research on BI in HE quality management shows institutions increasingly using BI dashboards specifically to monitor quality-assurance indicators continuously, rather than reconstructing them only when an accreditation visit is scheduled.
Across nearly all of these, the pattern is the same: a well-built system replaces static, backward-looking reports with living dashboards that let people ask follow-up questions on the spot.
Also Read: SaaS Intelligence: Turning SaaS Data Into Better Insights
Common Challenges in BI Adoption at Universities
Here’s the part most vendor blogs gloss over: BI implementations in higher education fail or stall far more often than they succeed cleanly on the first attempt, and the reasons are rarely about the software itself.
Data silos and legacy systems. Universities frequently run a patchwork of systems — a 15-year-old SIS, a newer LMS, a separately purchased CRM for admissions — none of which were built to share data cleanly. Integrating them is often the single largest cost and time sink in any BI project, dwarfing the cost of the BI software itself.
Data quality problems. Garbage in, garbage out applies brutally here. Inconsistent student ID formats across departments, duplicate records, and outdated field definitions mean a huge share of any BI project’s budget goes toward data cleaning before a single dashboard gets built.
Organizational resistance. Faculty and long-tenured staff sometimes view dashboards as surveillance tools rather than support tools, especially when workload or teaching-quality metrics are involved. Change management — explaining why the data is being collected and how it will (and won’t) be used — matters as much as the technical rollout.
Governance and ownership disputes. Who owns student data — IT, institutional research, individual departments? Without clear governance, BI projects stall in political disputes over access and control long before any technical issue arises.
Skills gaps. Many institutions buy powerful BI tools and then discover nobody on staff knows how to build meaningful dashboards or interpret the models correctly, leading to expensive software sitting mostly unused.
Underestimated ongoing cost. This is one of the most under-discussed issues in existing coverage of this topic: the licensing fee is often the smallest line item. Data engineering staff, dashboard maintenance, training, and system upgrades typically cost several times the initial software price over a five-year period — a detail that catches many finance offices off guard during budget renewal.
Student data privacy compliance. Almost no mainstream article on this topic addresses it directly, but it’s a real operational headache: in the US, FERPA restricts how student education records can be shared and analyzed, and in the EU, GDPR adds another compliance layer for any institution with international students. BI teams frequently have to build anonymization and access-control layers into dashboards just to stay legally compliant — a technical and legal challenge that adds real time to every rollout.
Best Business Intelligence Tools for Higher Ed
Most institutions choose from a fairly consistent shortlist, though the “best” choice depends heavily on existing infrastructure and budget.
Microsoft Power BI has become the default choice for many mid-sized universities, largely because of tight integration with Microsoft 365 and Azure, which most campuses already run. Its lower licensing cost compared to enterprise alternatives makes it attractive for public institutions with tight budgets.
Tableau remains popular for its visualization strength and is often preferred by institutional research offices that need to build highly polished, presentation-ready dashboards for boards and accreditors.
IBM Cognos and SPSS still run in the background of many larger and older public university systems, largely because of long-standing enterprise contracts rather than being anyone’s first choice today — a detail confirmed by industry surveys showing these tools still lead among the largest institutions even as newer platforms gain ground.
Oracle Analytics and SAP BusinessObjects show up more often at large research universities that already run Oracle or SAP as their core ERP, since native integration reduces the data-plumbing headache.
Purpose-built higher-ed platforms — like Entrinsik’s Informer, EAB’s analytics suite, and niche student-success platforms — have grown because they arrive with education-specific data models already built in, cutting months off implementation compared to configuring a generic BI tool from scratch.
The honest advice missing from most buying guides: the “best” tool is rarely the most powerful one — it’s the one that matches the skill level of the staff who will actually maintain it. A brilliant Tableau dashboard nobody on campus knows how to update becomes dead weight within a year.
How to Successfully Implement BI in Universities
Implementation is where most of the theory in this space either proves itself or falls apart. A workable rollout of business intelligence in higher education generally follows a sequence that skips corners at its own risk.
Start with one painful, visible problem. Institutions that succeed rarely launch BI as an abstract “data strategy.” They pick one urgent question — usually retention or enrollment forecasting — and build a single, genuinely useful dashboard around it first, proving value before asking for a bigger budget.
Audit and clean data before buying software. Skipping this step is the single most common cause of failed projects. Spend the first months mapping what data actually exists, where it lives, and how clean it really is, rather than assuming the new tool will magically fix decades of inconsistent record-keeping.
Establish clear data governance early. Decide, in writing, who owns which data, who can access what, and how privacy rules like FERPA apply before a single dashboard goes live — not after a conflict forces the issue.
Bring stakeholders in from day one, not after launch. Faculty and department staff who feel dashboards were imposed on them tend to ignore or distrust them. Institutions that involve end-users in defining what the dashboard should actually show see dramatically higher adoption rates.
Invest in training as heavily as in software. A recurring finding across BI research is that tool literacy, not tool sophistication, determines whether a system gets used. Budget real time for training advisors, department heads, and staff to read and act on dashboards, not just to view them.
Scale gradually, department by department. Rolling out BI campus-wide in one attempt tends to overwhelm both the technical team and end users. A phased rollout — starting with one college or division, refining the approach, then expanding — consistently outperforms a big-bang launch.
Measure the BI project itself. Ironically, many institutions that build dashboards to measure everything else forget to track whether the BI initiative is delivering value. Set clear success metrics up front — improved retention rate, hours saved on manual reporting, faster budget cycles — and revisit them annually.
Also Read: Retail Business Intelligence: Turning Data Into Decisions
Future Trends Shaping BI in Higher Education
The next phase of this field is being shaped by artificial intelligence layered directly onto existing BI infrastructure, rather than replacing it.
Predictive and prescriptive analytics are moving beyond flagging at-risk students to actually recommending specific interventions — suggesting which advisor should reach out, with which message, based on what has worked for similar student profiles historically.
Natural language querying is lowering the skills barrier significantly. Newer BI tools let a department head simply type or speak a question — “why did biology enrollment drop this fall?” — and get a generated chart back, instead of needing to build a query manually.
Mobile-first dashboards are becoming standard, since deans and advisors increasingly expect to check retention or budget dashboards from a phone between meetings rather than only from a desktop workstation.
Real-time, unified student 360 profiles are replacing siloed departmental views — combining academic, financial, engagement, and support-service data into a single student record that any authorized staff member can access, rather than needing to check five separate systems.
AI-assisted data governance is emerging as institutions realize manual compliance checking can’t keep pace with growing data volumes — automated tools now flag potential FERPA or GDPR violations in dashboard design before they ever go live, closing a gap that used to depend entirely on manual legal review.
Interoperability standards across SIS, LMS, and ERP vendors are slowly improving, driven partly by institutional pressure and partly by education-sector data standards initiatives, which should eventually reduce the integration costs that currently eat up most BI budgets.
Taken together, these shifts suggest the discipline is moving from a reporting function into something closer to an always-on advisory layer sitting quietly underneath every major institutional decision — not replacing human judgment, but making sure it’s rarely operating blind.

One Response